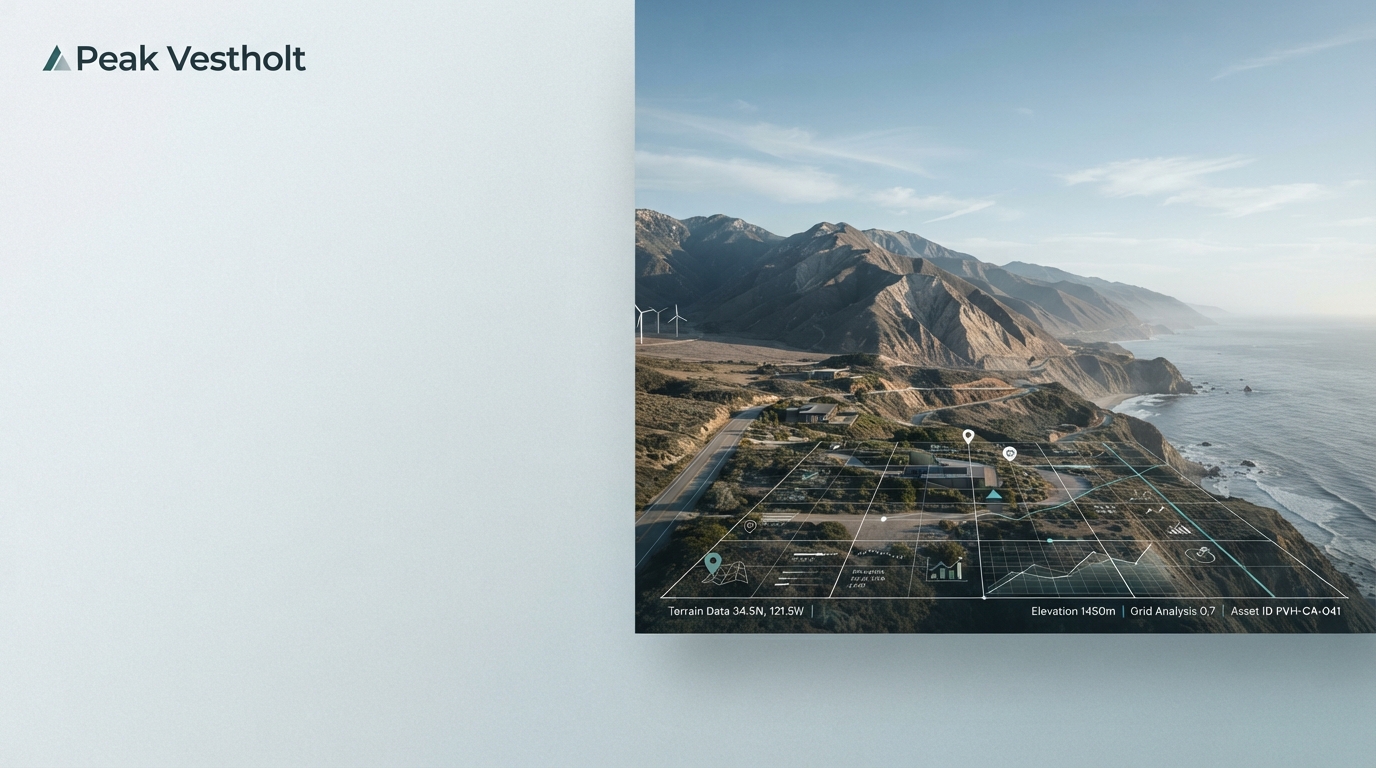
Built for investors who don't operate on a single time zone
Peak Vestholt combines automated risk modeling with continuous monitoring, so decisions don't wait on office hours, manual review cycles, or fragmented data sources.
Risk analysis that doesn't reset every time markets do
Most tools are built around static reports and delayed refresh cycles. Peak Vestholt was designed around a different assumption: that remote and cross-border investors need decision support that keeps pace with markets as they move, not after they close.
-
01
Models are structured to process signals as they arrive rather than batching them into end-of-day summaries.
-
02
The interface is built for quick scanning under time pressure, not dense reports that require a separate session to unpack.
-
03
Deployment is intentionally straightforward, so setup doesn't become its own project before any insight is produced.

Reasons investors choose Peak Vestholt over generic analytics tools
These are the distinctions that matter most when a platform is meant to be used daily, under real time constraints, rather than opened occasionally for a report.
Purpose-built for risk, not general BI
Peak Vestholt isn't a repurposed dashboard tool. Every module exists to support one function: helping investors evaluate and act on risk faster.
Designed for distributed teams
Whether reviewing positions from a different city or a different time zone entirely, the platform is structured so context doesn't get lost between sessions.
Output built for decisions, not archives
Analysis is presented to support an immediate choice — hold, adjust, or escalate — rather than buried in a report meant only for record-keeping.
Consistent framework across markets
Rather than switching tools per region or asset type, Peak Vestholt applies a consistent modeling approach across the positions you're tracking.
Reduced setup overhead
Getting from account creation to usable output is treated as a core design constraint, not an afterthought handled by onboarding calls.
Built to fit varied portfolios
Configuration options are kept practical, so the platform can be adjusted to different risk tolerances without requiring a rebuild each time.
These points describe the design intent behind Peak Vestholt. Actual performance depends on the data connected, the markets covered, and how the platform is configured for a given use case.
Common situations investors bring to Peak Vestholt
Managing positions across multiple markets
When holdings span several markets with different trading hours, keeping risk assessment centralized becomes harder the more fragmented the tracking gets. Peak Vestholt is structured to bring that view into one consistent place.
Reviewing risk outside standard hours
Not every relevant decision happens during a conventional workday. The platform is built so meaningful review can happen whenever it's actually needed, not only when a desk-based process allows it.
Reducing reliance on manual report compilation
Pulling numbers into spreadsheets before every decision adds friction and delay. Peak Vestholt is designed to shorten that gap between data and action.
How teams typically begin working with Peak Vestholt
Connect
Link the relevant accounts or data sources you want the model to evaluate.
Configure
Set risk parameters and thresholds that reflect how you actually want alerts and scoring to behave.
Review
Use the dashboard to scan current risk signals and understand what's changed since the last check-in.
Adjust
Refine settings over time as your portfolio, priorities, or market conditions shift.
See whether Peak Vestholt fits how you actually work
Deploy a model against your own portfolio setup and evaluate the output directly, rather than taking claims at face value.